Project
🧭Social Compass🧭
🦋
Transformation of Politics, Policy & Ideas
into real results!
Project Social Compass enables brainstorming and dynamic exploration of polices and ideas. It addresses U.S. bills, governance, budgets, and oversight. Designed to be easy-to-read mappings with options to deep dive into legal jargon and documents. Applicable to education, policy review/development, and campaigning.
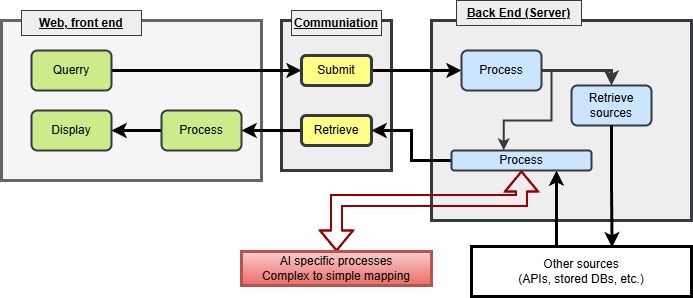
🧠 Overview & ⚙️Technical Highlights
Core Components:
- Frontend:
- Submit: Interactive graph UI for ideas and submissions
- Display Adjust: Dynamic, adjustable concept map view
- Conduits: API connections, between frontend and backend software
- Backend:
- Fetches: Data pull from government bills and budget APIs
- Preprocessing ETL: Tokenizing and mapping documents and data
- Interface exchange: Maps user inputs, returns updated information

👨💻 Creator’s Note
Over the last decade, I’ve been curious about how AI and the future of our government will intersect. This includes a startup I worked on back in 2016 to analyse legal documents. I am resurrecting that idea and applying it to the current legal challenges that face the public and our policymakers. There are numerous bill searches and information available, but none of them effectively present the details in a way that the average person can easily understand. Our legal code is so complex that most lawyers can barely comprehend anything outside their direct expertise. The MVP (Minimal Viable Product) is to have an idea submitted and mapped connections of ideas and policies displayed in a simplified, easy-to-read format. Future development would then be more focused on brainstorming and mapping ideas in a holistic manner.
🧪 Development Timeline
➖ Phase 1: R&D & Concept Design
- ✅ General Plan and idea
- Audit similar tools (open‑source & proprietary)
- Define data sources, graph structure, UI flow
- Validate feasibility and user flows
➖ Phase 2: MVP
- Basic frontend placeholders
- API endpoints for user input and policy output
- Backend data ingestion & parsing
- Initial concept‑map rendering
➖ Phase 3: UI Polish & AI Integration
- Upgrade frontend to a refined, interactive graph UI
- Implement backend logic and AI-driven pattern mapping
- Optimize graph performance and usability
➖ Phase 4: Documentation & Community
- Publish build‑process blog series (“lessons learned”)
- Share demos, screenshots, and video walkthroughs
- Release modular open‑source components
- Invite community feedback and explore applied use cases
🧩 Future Enhancements & Suggestions
| Feature | Description |
|---|---|
| User onboarding flow | Add guided tours to help users start brainstorming with minimal friction |
| Fact-checking layer | Integrate fact-check sources and evidence scoring for each connection |
| Collaboration tools | Enable sharing, commenting, and versioning of maps among users or teams |
| Export options | Allow export of graphs and reports (PDF, image, data formats) |
| Advanced analytics | Heatmaps, filters, and scenario simulation (e.g., budget changes, policy shifts) |
| Multi-jurisdiction support | Scale beyond federal to include state or local laws |
| API access | Let external apps pull refined map data or integrate submission flows |